Issue No. 72 • Wednesday September 2, 2026 The Trading Addict Newsletter by Maria Helmick 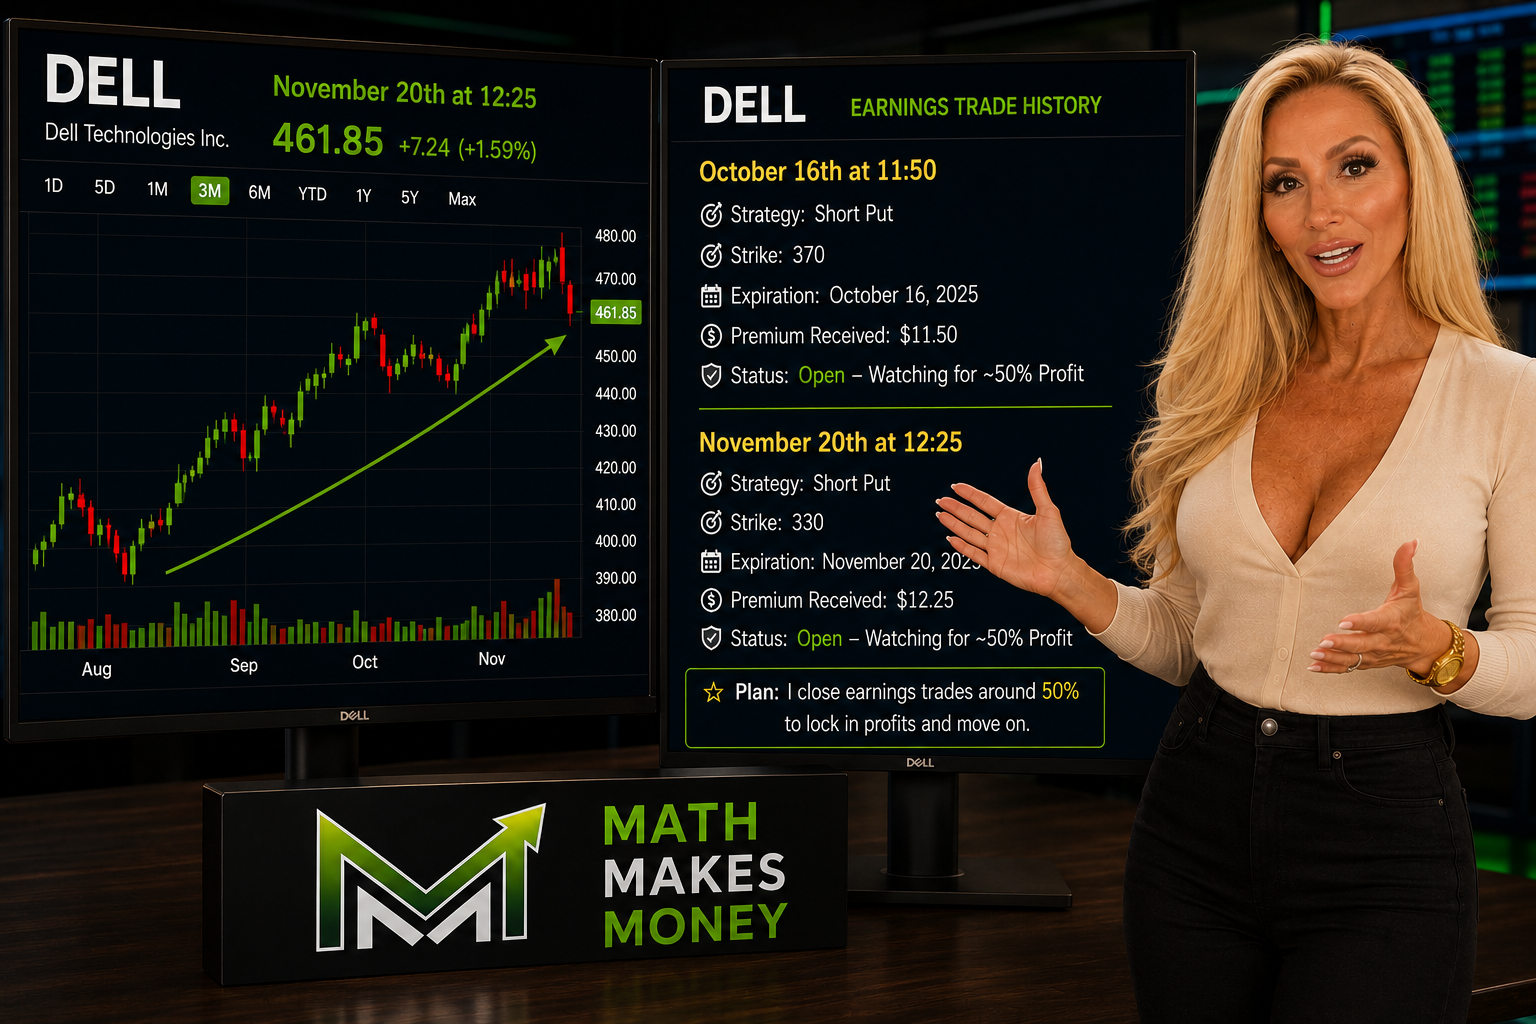 Tap the image to view full size Maria's Earnings Trade Update · Sep 1, 2026 Dell Delivers — Then Raises the BarA major earnings beat, a $95 billion AI backlog and two open short-put trades positioned well below the stock. | $7.04 Adjusted EPS $4.91 expected |
| $47.0B Revenue $44.9B expected |
| | |
| Dell Did More Than Beat ExpectationsDell Technologies (DELL) reported an exceptional fiscal Q2. Adjusted earnings reached $7.04 per share, far above Wall Street's $4.91 estimate. Revenue climbed 58% to a record $47.0 billion, also topping expectations. The AI-server business was the standout. Dell booked a record $60.9 billion in AI-server orders, generated $16.4 billion in AI-optimized server revenue, and ended the quarter with a record $95 billion backlog. Infrastructure revenue rose 89%, traditional servers and networking grew 122%, storage increased 26%, and client solutions advanced 20%. The Guidance May Be the Strongest PartManagement raised full-year revenue guidance from $167B to $192B. Adjusted EPS guidance jumped from $17.90 to $25.50, and expected AI-server revenue increased from $60B to $74B. For next quarter, Dell expects approximately $49B in revenue and $6.50 in adjusted EPS — both comfortably above Wall Street's forecasts. DELL had fallen about 7% during the regular session, but the report sent the stock sharply higher after hours, recovering the day's decline. The reaction reflects more than a headline beat: Dell showed accelerating AI demand, improving profitability, and substantially stronger expectations for the remainder of the year. Maria's Open Dell Earnings Trades| Expiration | Short Put | Credit | Status | | Oct 16, 2026 | $370 strike | $11.50
$1,150/contract | Open
Watching 50% profit | | Nov 20, 2026 | $330 strike | $12.25
$1,225/contract | Open
Watching 50% profit |
Maria's Bottom Line Dell gave me exactly what I wanted from an earnings trade: a powerful beat, higher guidance, and a strong after-hours reaction. Both of my short puts remain open, and I anticipate they will work out nicely. I will look to close each trade once it reaches around 50% profit. |
Sources: Dell Technologies fiscal Q2 2027 earnings release and company guidance. Not a recommendation. |
Vera 3.0 · Final AVGO Update Vera's Final Update on AVGO TradeVERA DECISION: ENTER the Oct 16 $330 put at $8.25 or better, provided AVGO remains reasonably stable before earnings. | | With AVGO around $369.65, the $330 strike is approximately 10.7% below the stock and sits around 21 delta. At an $8.25 credit, the effective basis becomes $321.75 — about 13% below the current share price. Over AVGO's last four earnings reports, the average absolute move has been approximately 9.6%. The $330 strike sits slightly beyond that average move, while the premium provides additional downside cushion. Individual earnings moves can exceed the average, so this remains an earnings-risk trade. Support Matters HereAVGO has support around $360, with a more important support zone near $350. That puts the $330 strike below both support areas, with the $321.75 effective basis providing additional room. Off-exchange activity has been substantial, but available dark-pool data does not provide a reliable bullish or bearish signal ahead of earnings. Entry Plan$8.25 or better is acceptable. My preference is to wait until around 3:45 p.m. ET tomorrow to see if pre-earnings volatility provides additional premium. We do not automatically take the midpoint. If AVGO remains stable and the market offers more than $8.25, take the better credit. If AVGO drops materially before entry, reassess the strike rather than chase the higher premium. Final Call Enter the $330 put at $8.25 or better if the setup remains intact. Be prepared either to own AVGO at the effective basis, or actively manage the position if necessary — including closing or rolling down and out when the economics justify it. |
Screenshot provided Sep 1, 2026 ~5:45 p.m. ET. Recheck stock, premium, delta before entry. Options involve substantial risk. |
 Tap the image to view full size Market Note · Sep 1, 2026 September Has a Bad Reputation. But Look at This.September is historically a difficult month for stocks. The more useful question is whether the market enters the month strong or already wounded. | September makes Wall Street nervous for a reason. Historically, it has been the worst-performing month of the year for the S&P 500. That reputation is real, but it can hide an important distinction: not every September begins with the market in the same condition. A simple way to separate stronger markets from weaker ones is the 200-day moving average — the S&P 500's average closing level over roughly 200 trading days. Trading above that line generally means the longer-term trend is healthy; trading below it means the market is already showing weakness. The 97 SeptembersThe historical data examined 97 Septembers. In 70, the S&P 500 entered September above its 200-day MA. In the other 27, it entered below it. | S&P Entering Sept | Above 200-Day | Below 200-Day | | Number of Septembers | 70 | 27 | | Average return | +0.02% | -3.82% | | Median return | +0.50% | -3.67% | | Loss greater than 8% | 1 of 70 | 7 of 27 |
The number that jumps off the page: an 8%+ September decline occurred only 1 time in 70 above the 200-day average. Below it, the same decline happened 7 times in 27 — roughly 1% versus 26%. |
Where Does This September Start?This September begins with the S&P 500 comfortably above its 200-day moving average. That places the market in the historically stronger group. It doesn't guarantee a positive month, but it challenges the idea that September's reputation alone is reason to expect a major selloff. Fear & Greed: 50 Is More Interesting Than It LooksThe Fear & Greed Index was at 50 — Neutral. Investors are sitting in the middle: they're not chasing stocks recklessly, but they're not running for the exits either. If September gets rough and the index slides toward fear, that tells us investor behavior is actually changing. For a premium seller, that matters because increasing uncertainty can push volatility and option premiums higher. Two things matter more than the calendar: Does the S&P remain above its 200-day moving average, and does Fear & Greed begin moving decisively toward fear? Maria's Bottom Line As a premium seller, I expect volatility and I welcome it. Bigger market swings can create richer premiums and better opportunities, so I'm not going to change the way I trade simply because September has a bad reputation. The history is reassuring: when the S&P 500 has entered September above its 200-day moving average, the really ugly declines have been rare. That doesn't mean I ignore risk. It means I trade the market in front of me, not the month on the calendar. September may bring volatility. For a premium seller, that can bring opportunity. |
|
A Wall Street Market Tidbit The Stock Market That Wasn't Supposed to ExistNew York · 1914 | On July 31, 1914, Wall Street locked the doors of the New York Stock Exchange. World War I had erupted, and European investors were expected to unload billions in American stocks and demand payment in gold. That could have drained U.S. reserves and sent the financial system into a panic. The plan was simple: close the market and stop the selling. Wall Street found another way. Within days, brokers gathered in New Street, the narrow alley behind the Exchange, and created a secret cash market. As many as 35 brokers traded up to 40,000 shares a day while the official market remained closed. Authorities knew. They largely looked the other way — but prices from the alley were kept out of major newspapers. The public wasn't supposed to see how far stocks had fallen. Four months later, the NYSE cautiously reopened with minimum prices designed to prevent another rush for the exits. Wall Street survived — not because the selling stopped,
but because it moved into an alley where almost no one could see it. |
|
» EARNINGS WATCH · AUG 31 – SEP 4 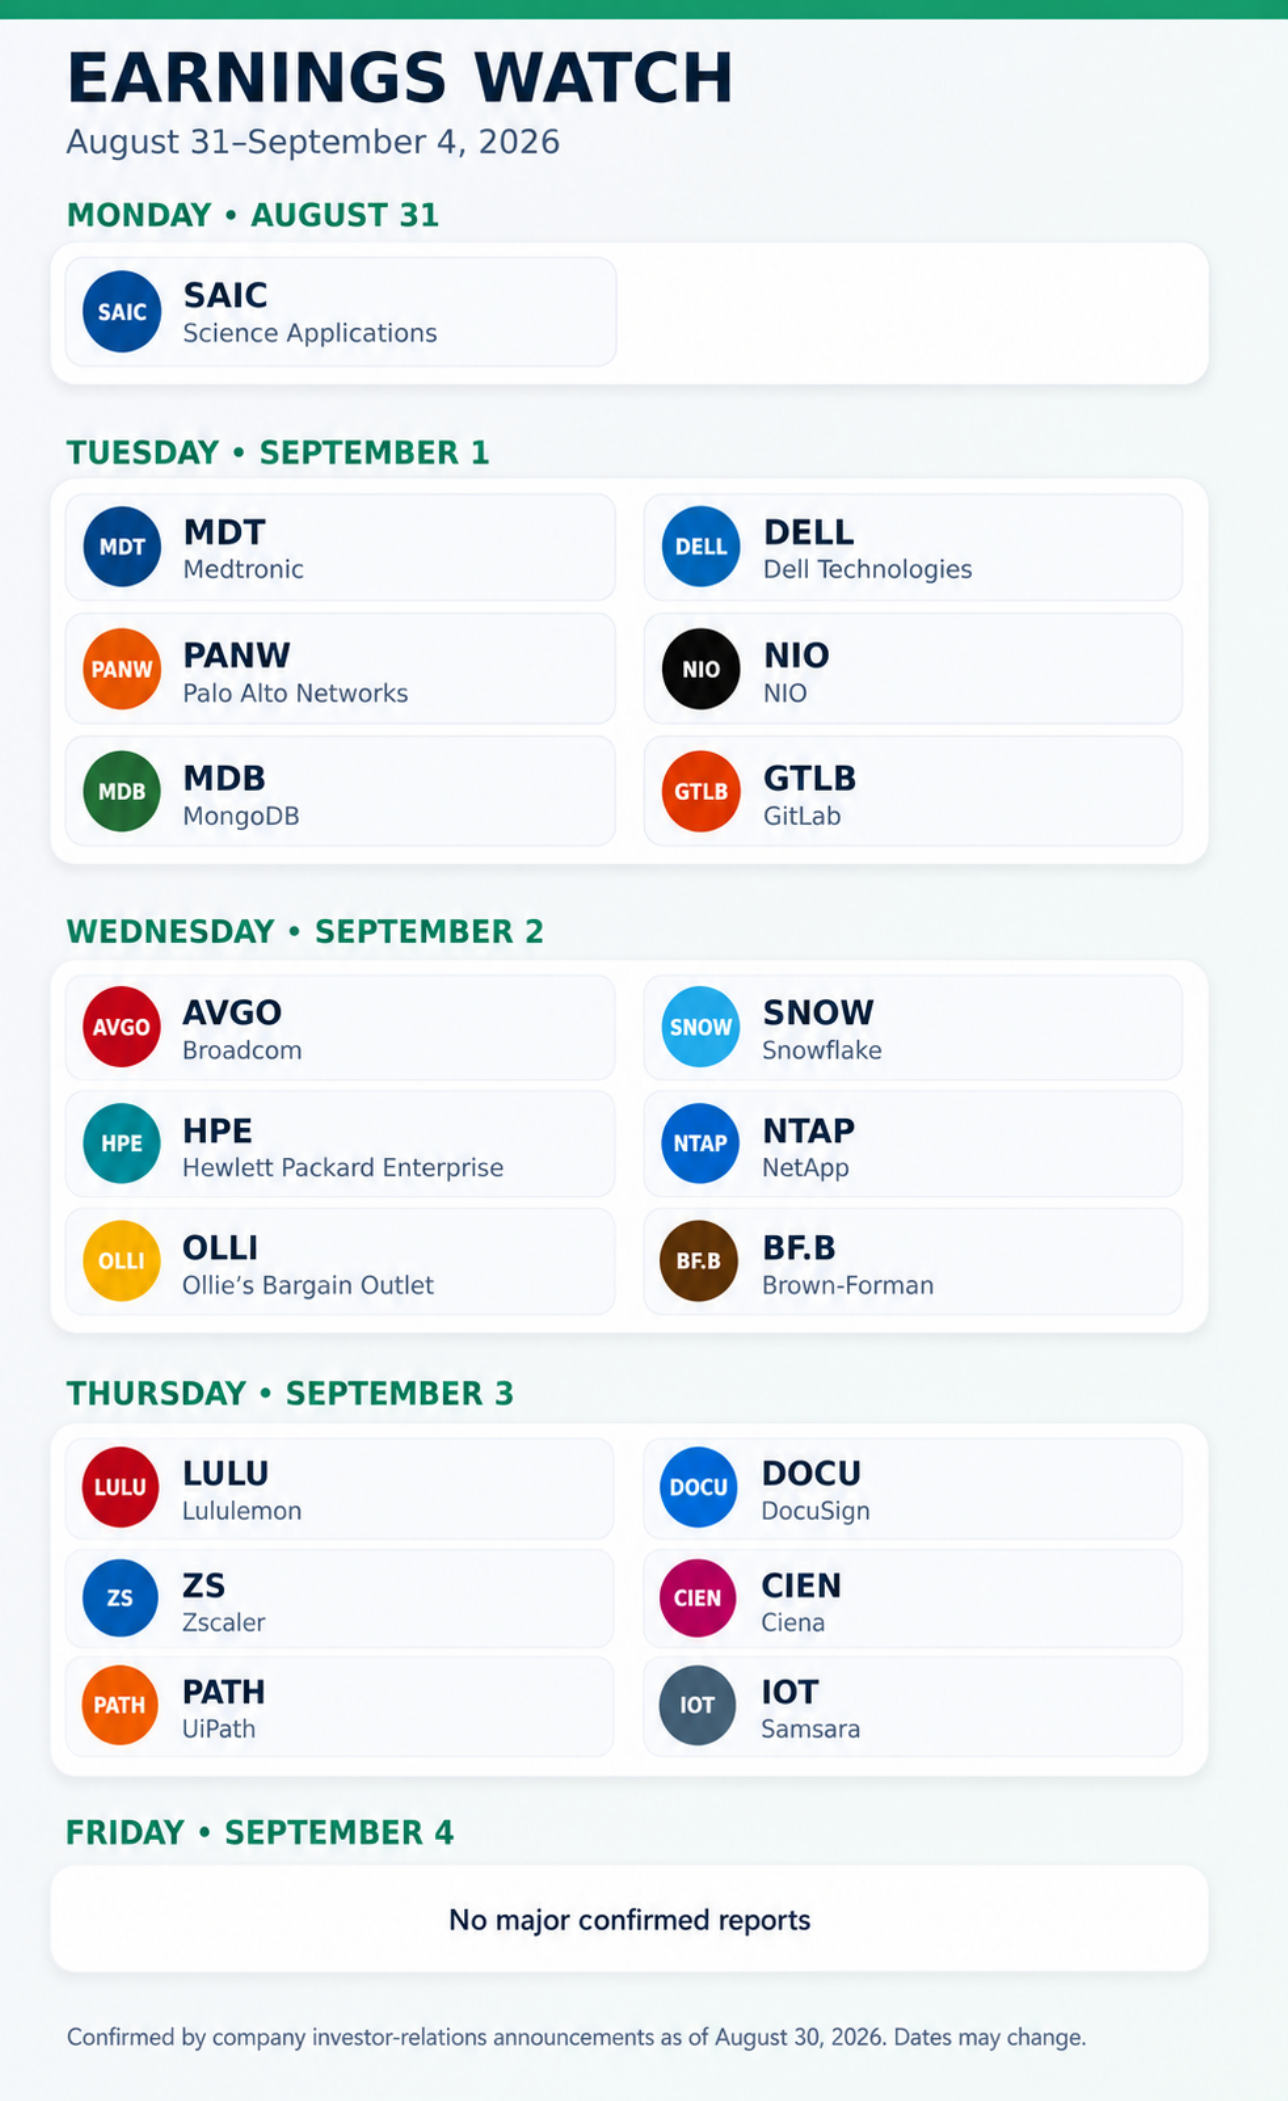 Tap to view full size » TRADE WITH US  » TAP THE CARD ABOVE TO JOIN THE MATH MAKES MONEY TRADING TEAM AT MATHMAKESMONEY.COM » SEMICONDUCTOR HEATMAP · SEP 1 CLOSE 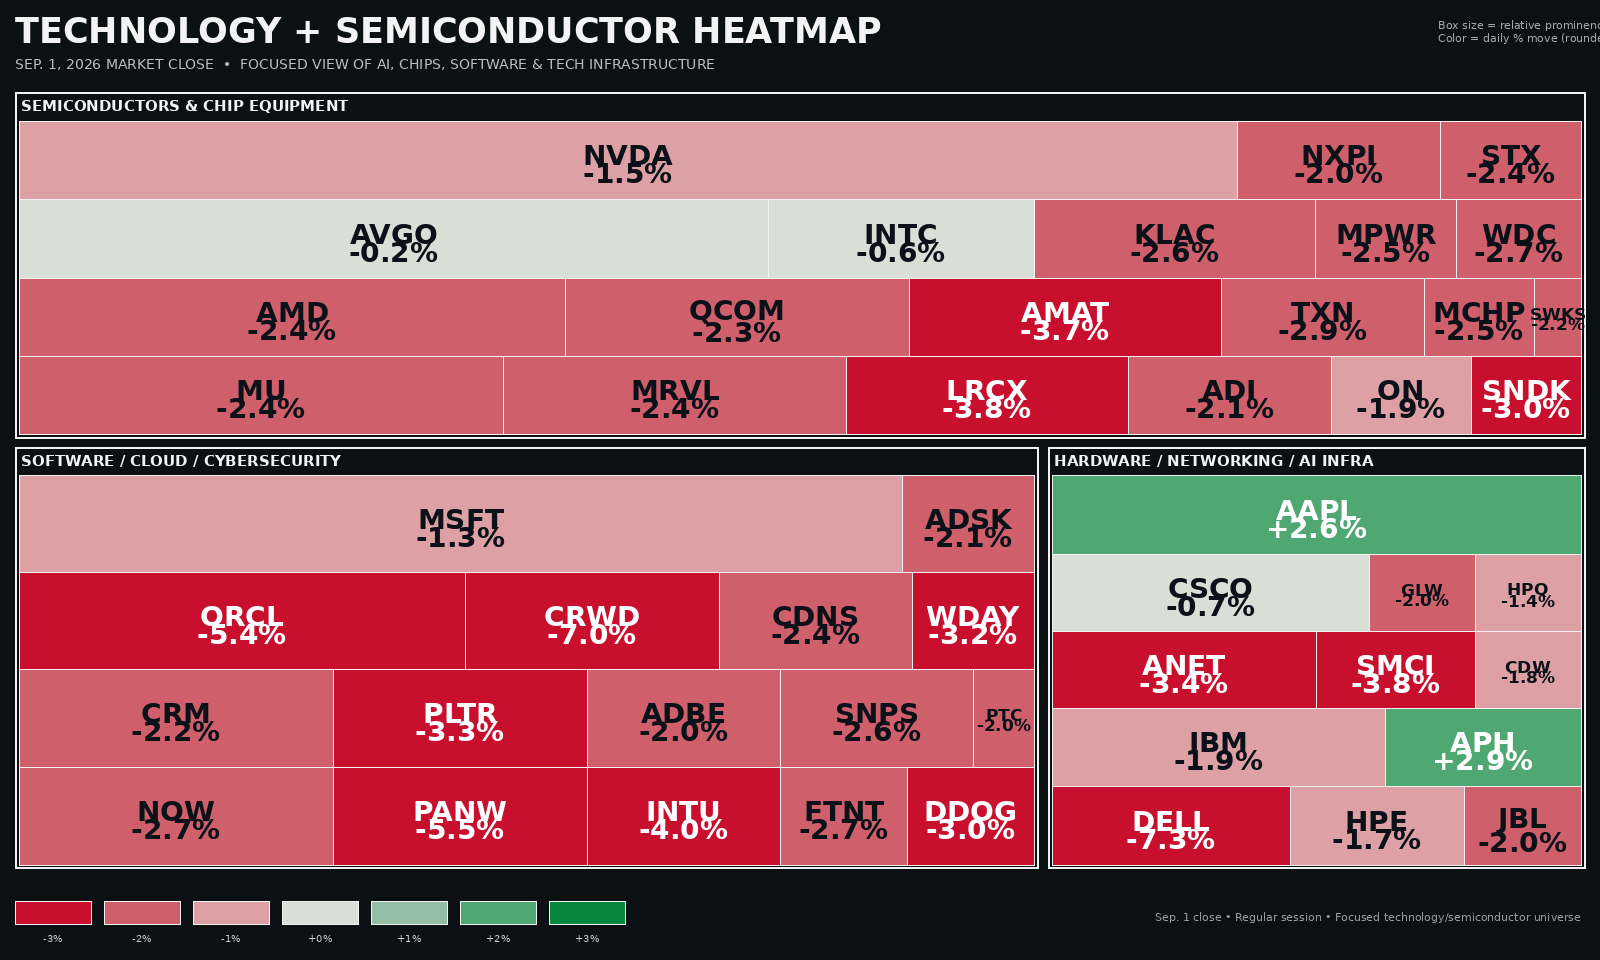 Tap to view full size » DAY 219 · TUE SEP 1 · DAILY TRADING UPDATE 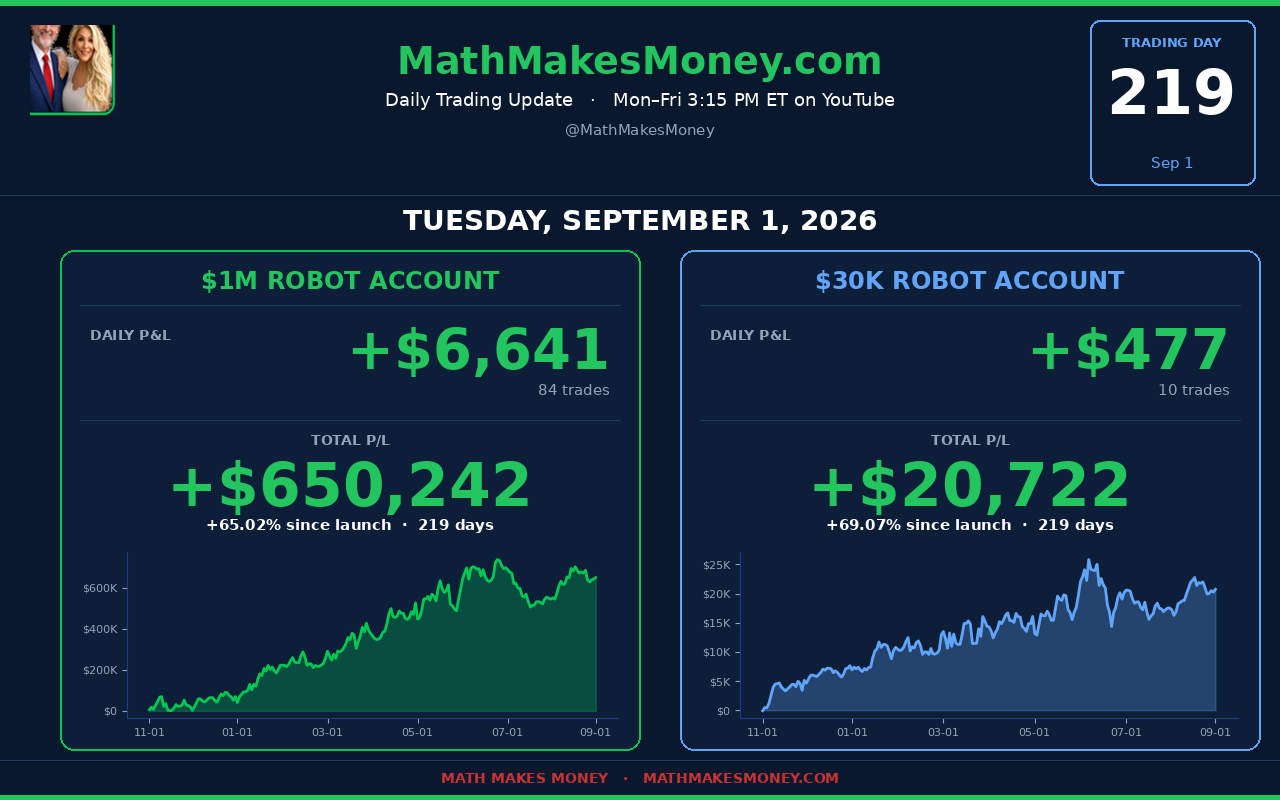 Tap the dashboard to see the full summary online » TODAY'S LIVE SHOW  » Tap to watch today's live show — 9:15 AM & 3:15 PM ET Monday through Friday, plus Sunday 5:55 PM ET Free Community Join our Discord with over 1,000 like-minded traders who believe that math makes money when it comes to trading Trade ideas, screenshots, daily banter. Zero cost. Join the Discord → |
MATH MAKES MONEY Rob and Maria Helmick and Nick Battista · The Trading Addict Newsletter MathMakesMoney.com Educational only. Not investment advice. Trading options involves substantial risk. Past performance does not guarantee future results. |
|