Issue No. 53 • Thursday August 6, 2026 The Trading Addict Newsletter by Maria Helmick Newsletter Scorecard · Wednesday After the Bell Wall Street's Biggest Earnings | BEATS SNDK BIG BEAT · EPS $39.25 vs $34.96, Rev $8.97B vs $8.48B — AI storage demand.
FIG BEAT + RAISE · EPS $0.08 vs $0.04, Rev $370M vs $352M — 136% net retention.
IONQ BIG BEAT · Rev $80.1M vs $66.5M — loss much smaller than expected.
EBAY BEAT + RAISE · Rev $3.13B vs $3.02B — Q3 guide topped estimates.
ALB STRONG BEAT · EPS $3.75 vs ~$3.10 — lithium prices rebounded.
WDC BEAT · EPS $3.56 vs $3.31, Rev $3.75B vs $3.70B.
XYZ (Block) BEAT · EPS $1.02 vs ~$0.87 — Cash App +31%, Square +13%.
NWS BEAT · EPS $0.35 vs $0.24, Rev $2.34B vs $2.25B — Dow Jones drove record profits. MIXED / CAUTION APP MIXED-POSITIVE · Rev ~$1.93B (+53%), guidance ~$2.08B kept AXON story intact.
DASH BEAT + CAUTION · GOV $33.08B, but Q4 margins will decline.
DUOL MIXED · Rev $298.5M, DAUs +23%, but soft Q3 guidance. |
Green = clear beat or beat-and-raise. Amber = mixed or beat with an important caution. EPS adjusted where reported. Cloudflare excluded (had not yet reported). |
The AI Trading Institute AUGUST COHORT WAITLIST OPEN The July cohort sold out. Add your name to the August waitlist and we'll notify you the moment enrollment opens. Join the August waitlist → |
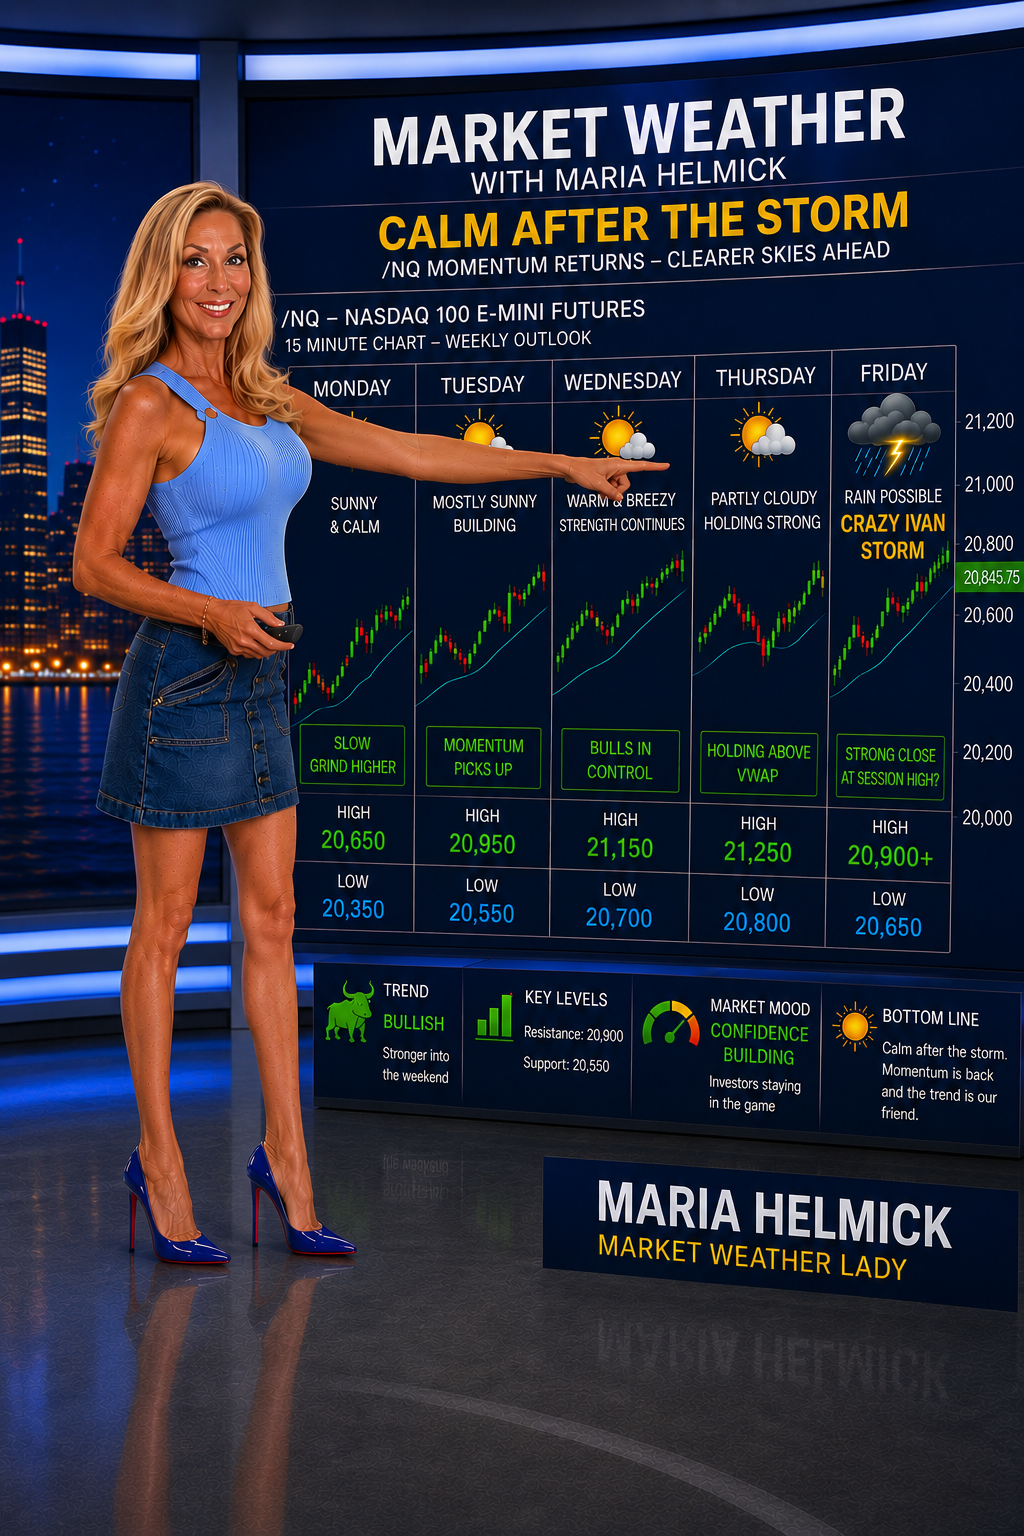 Tap the image to view full size Maria's Market Insights · August 2026 Calm After the Storm?What the market is really telling us about momentum, AI leadership and investor confidence. | The market has shifted from defense to offense. The S&P 500 has gained more than 5% in four trading sessions and reached another record high, while investor sentiment has moved quickly from fear to greed. Buyers are stepping back in despite unresolved concerns surrounding earnings, tariffs and geopolitical risk. What makes the move more notable is that the rally is no longer relying solely on a few mega-cap technology stocks. More areas of the market are participating, and investors appear increasingly willing to buy pullbacks rather than treat every negative headline as a reason to sell. Fear Is Giving Way to ConfidenceThe Fear & Greed Index measures investor sentiment on a scale from 0 to 100 using seven indicators, including market momentum, stock strength, trading volume, put-and-call activity, volatility, safe-haven demand and junk-bond demand. 59 TODAY Greed | 45 YESTERDAY Neutral | 37 1 WEEK Fear | 32 1 MONTH Fear | 56 1 YEAR Greed |
Scale: 0-24 Extreme Fear · 25-44 Fear · 45-55 Neutral · 56-74 Greed · 75-100 Extreme Greed. Snapshot of sentiment, not a stand-alone buy/sell signal. Only a month ago, investors were focused on everything that could go wrong. Today, they are becoming more comfortable putting money back to work. The index has entered Greed, but not Extreme Greed — suggesting optimism is rising without yet reaching the kind of enthusiasm that can become excessive. Momentum Is Building — and the Rally Is BroadeningThe S&P 500 has gained more than 5% in four sessions and reached another record high. At the same time, leadership is spreading beyond the Magnificent Seven into data centers, networking, power generation, industrial automation and software. Nvidia remains the leader in AI, but the market is no longer depending on Nvidia alone. That broader participation is a stronger sign than another rally carried by only a few mega-cap stocks. The extraordinary gains produced by the Magnificent Seven are also beginning to moderate: Magnificent Seven Returns 2023: +106.8% · 2024: +64.0% · 2025: +24.7% · 2026 YTD: +4.0% |
That does not automatically signal weakness. As these companies grow larger, maintaining triple-digit returns becomes increasingly difficult. The next stage of the market may depend less on seven technology giants and more on the companies providing the infrastructure, energy, equipment and software needed to support the AI buildout. Maria's Bottom Line Overall, I like what I'm seeing. The rally is becoming broader, investor confidence is improving, and the market continues to absorb bad news better than it did just a few weeks ago. That's usually a sign the bulls are still in control. I have to admit, I took my share of profits — call it smart risk management or call it greed if you'd like. Either way, I chose to lock in gains rather than assume the market would keep going straight up. There's nothing wrong with ringing the register once in a while. |
|
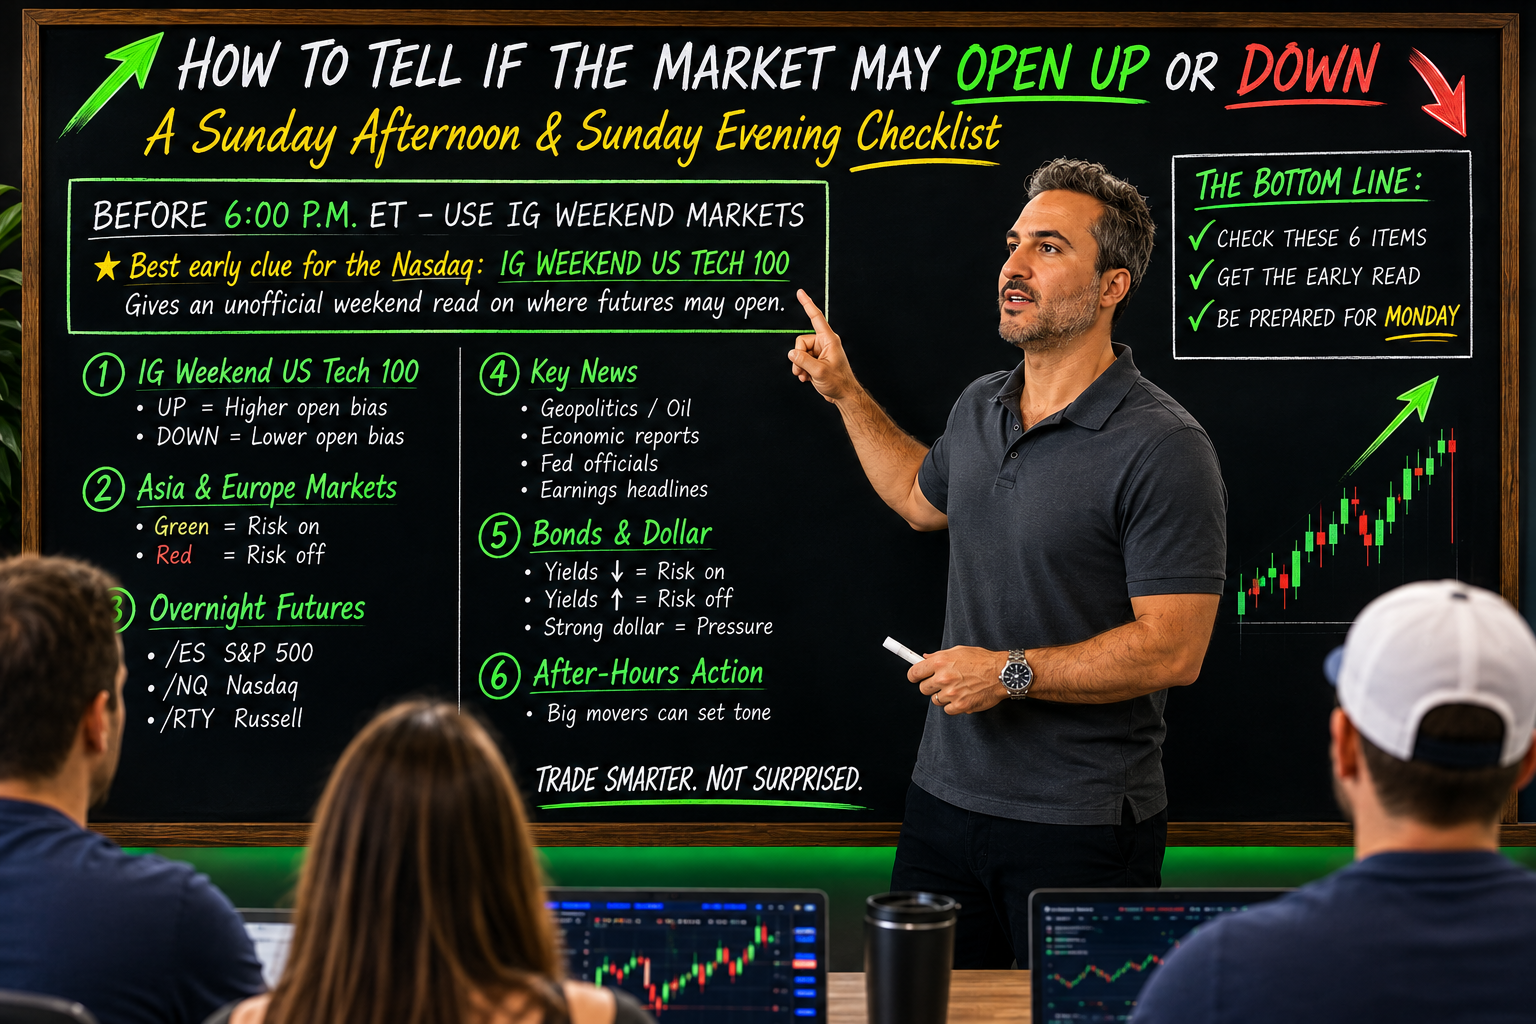 Tap the image to view full size Sunday Market Opening Guide How to Tell if the Market May Open Up or DownA Sunday afternoon and Sunday evening checklist. | Before 6:00 p.m. ET — Use IG Weekend MarketsBest early clue for the Nasdaq: IG Weekend US Tech 100. It gives an unofficial weekend indication before the official Nasdaq futures market reopens. How to read the weekend indication Within ±0.25%: Basically flat. Weak signal.
+0.50% or more: Meaningful positive indication.
-0.50% or more: Meaningful negative indication.
More than ±1.00%: Significant weekend reaction to news or risk. |
IMPORTANT: IG weekend pricing is not the official CME futures market. It can differ substantially from the real futures opening at 6:00 p.m. ET. At 6:00 p.m. ET — Check the Real FuturesWhen the official futures market reopens Sunday evening, check these on your trading platform: | /NQ | Nasdaq-100 · best read for large technology stocks | | /ES | S&P 500 · best broad-market indication | | /YM | Dow · large industrial and value stocks | | /RTY | Russell 2000 · small-cap risk appetite |
Best Times to Check Before 6:00 p.m.: Use IG Weekend US Tech 100 for an unofficial first clue.
6:05 p.m.: See the first official /NQ and /ES indication.
6:30 p.m.: Check whether the first move is holding or reversing.
8:00-10:00 p.m.: Asian trading begins to influence overnight direction.
Monday 8:30 a.m.: Economic reports can completely reverse the overnight move. |
The Sunday Rule Before 6:00, IG gives you the market's first weekend reaction. After 6:00, /NQ and /ES give you the official futures indication. Neither guarantees where Monday will actually open. Do not trust the first five minutes. Sunday evening volume can be thin, and one large order can exaggerate the move. The more useful signal is whether futures continue strengthening or begin reversing as the evening progresses. |
|
Beehive Market Brief · August 6 Earnings After the BellThursday's slate: cloud software, digital advertising, consumer platforms, quantum computing and crypto infrastructure. | Big Names Reporting ABNB $1.26 · bookings/summer demand
NET $0.27 · AI demand and guidance
TEAM $1.49 · cloud and enterprise growth
DKNG $0.03 · revenue and profitability
ROKU* $0.60 · platform and ad revenue
TTD $0.18 · ad growth and Kokai
TWLO $1.32 · organic growth and margins
LYFT $0.15 · bookings and pricing
CART $0.54 · orders and ad revenue
MARA $0.17 · Bitcoin production and mining costs
MP ($0.01) · rare-earth pricing and magnet production
AAOI $0.02 · AI optical-networking demand
RKT $0.17 · mortgage volumes and rates
RGTI ($0.05) · quantum roadmap and cash usage
RCAT ($0.20) · drone production and defense orders
SG ($0.13) · same-store sales and margins
TXRH $1.83 · customer traffic and food costs
DOCS $0.30 · pharma advertising
DBX $0.74 · paying users and cash flow
AKAM $1.57 · security growth
FROG $0.24 · cloud and enterprise revenue
INOD $0.21 · generative-AI growth
CRSR $0.07 · gaming demand and margins |
Roku Note Roku will release quarterly financial results, but it will not hold an earnings call or provide forward guidance because of its pending acquisition by Fox Corporation. |
EPS figures are adjusted consensus estimates. Parentheses indicate an expected loss per share. Consensus may change before companies report. |
Market Structure · 3 min Why Cboe Had to ExistThe exchange that made risk itself tradable. | The NYSE created a marketplace for owning companies. Cboe created a marketplace for trading the risk around them. |
By 1973, the New York Stock Exchange had already been trading stocks for generations. But options were a different creature. They were not shares of a business; they were contracts about what those shares might do next. Most options still traded over the counter through private negotiations. One contract could differ from the next. Strikes, expirations and other terms were not uniform. Prices were difficult to compare, liquidity was scattered, and closing a position could mean finding someone willing to take the exact agreement off your hands. Then came the deeper problem: counterparty risk. A profitable trade was only as dependable as the person on the other side. If that party failed, the contract's value could disappear with the promise. The missing ingredient wasn't another stock exchangeIt was a system that could turn one-off agreements into interchangeable, liquid and reliably cleared instruments. Cboe opened on April 26, 1973 as the first organized U.S. marketplace for standardized, listed equity options. Its first session was tiny — 911 call-option contracts on 16 stocks — but the structure behind those trades was revolutionary. Standard terms Common strikes, expirations and contract sizes made contracts comparable. | Centralized trading Buyers and sellers met in one visible market instead of scattered dealer networks. | Reliable clearing A clearing organization stood between both sides, reducing the risk of nonpayment. | Tradable positions A trader could exit without renegotiating with the original counterparty. |
The takeaway: The NYSE made company ownership liquid. Cboe made uncertainty liquid — giving investors a standardized way to hedge risk, generate income or express a view about where prices might go. |
Read the Original History The Options Markets Come of Age: Their Past, Present and Future (SEC, 1981). Official history of listed options. OPEN THE SEC DOCUMENT → |
Educational market history. Options involve risk and are not suitable for every investor. |
» DAY 200 · WED AUG 5 · DAILY TRADING UPDATE 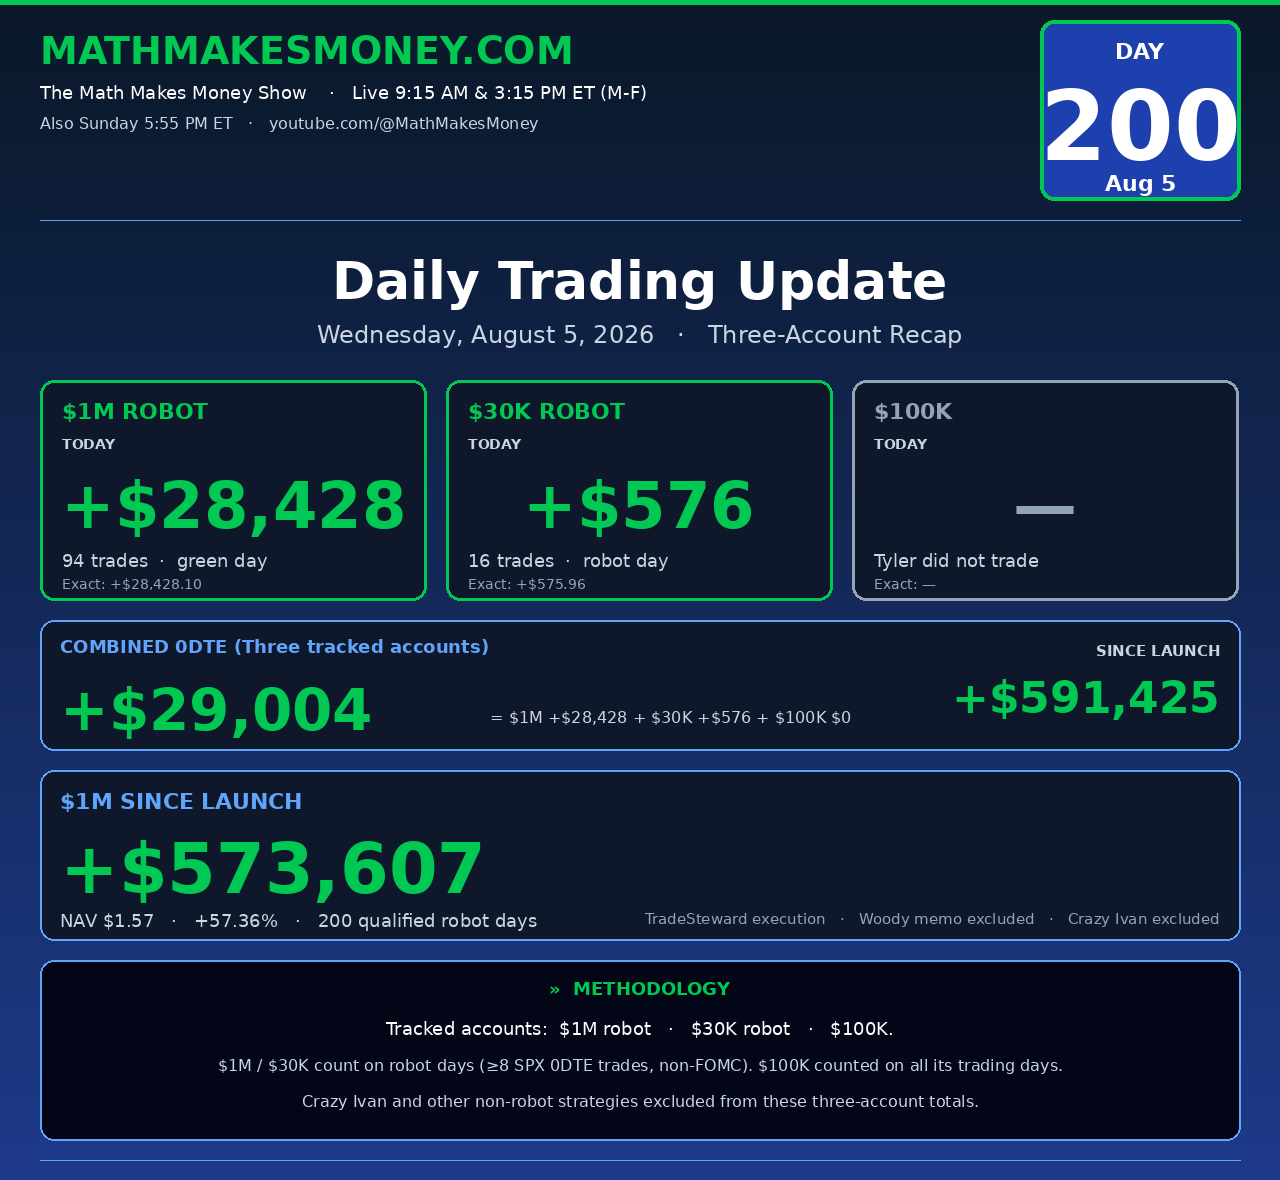 Tap the dashboard to see the full summary online  » Tap to watch the live daily show at 9:15 AM and 3:25 PM Monday through Friday, as well as Sunday at 5:55 PM ET » TRADES OF THE WEEK Week of August 3 — Two SPX 0DTE trades | | Entry Time | Strategy | | 11:25 | 145 M 95 50 00 | | 15:37 | 185 M 95 50 00 |
Two SPX 0DTE plays — late-morning and late-day. Different strategies at different entry times. |
Free Community Join a community of 900+ like-minded traders in our Discord who trade based on math Trade ideas, screenshots, daily banter. Zero cost. Join the Discord → |
MATH MAKES MONEY Rob and Maria Helmick and Nick Battista · The Trading Addict Newsletter MathMakesMoney.com Educational only. Not investment advice. Trading options involves substantial risk. Past performance does not guarantee future results. |
|